And here is the data we collected and used in our sketch.
Click Here
Showing posts with label IDAT106. Show all posts
Showing posts with label IDAT106. Show all posts
Monday, 26 April 2010

Sunday, 25 April 2010
The Processing Sketch
Thanks to Jon our sketch is now online to be viewed. It can be seen here. You may have to wait a while for the first balls to appear. The rate the balls appear is determined by when the bluetooth device was first detected.
So thats it we have transformed Stonehouse by importing activity from other areas and puting it into Stonehouse.
So thats it we have transformed Stonehouse by importing activity from other areas and puting it into Stonehouse.
The Visual Element is Complete - Part 2
Continuing on from the last post here is some more code from our Processing Sketch and what it all does.
This checks to see if a particular device had been detected yet.
And all of this code controls the bouncing balls. It detects if they bounce of the sides, the ground or eachother and then acts accordingly.
And finally this code is just to display the image of the street behind it all. Thats all folks the sketch has been complete.
for (int r= 0; r < count; r++){
if((Fdetect[r] < metricTime)&&(metricTime < Fdetect[r]+3000)){
active[r] = "true";
}else{
active[r] = "false";
}
This checks to see if a particular device had been detected yet.
for(int z = 0; z < count;z++){
if(active[z] == "true"){
//BALL - WALL COLLISIONS
if((posX[z] < rad)||(posX[z] > width -rad)){
speedX[z] = -speedX[z] *loss;
}
if((posY[z] < rad)||(posY[z] > height)){
speedY[z] = -speedY[z] *loss;
}
if(posZ[z] < -10000 +rad){
speedZ[z] = -speedZ[z] *loss;
}
//balls that go beyond the camera are deactivated
if(posZ[z] > 1000){
active[z] = "false";
}
//BALL - BALL COLLISIONS
for(int others = 0; others < count;others++){
if(others != z){
if(ballSize > dist(posX[z],posY[z],posZ[z],posX[others],posY[others],posZ[others])){
TspeedX = speedY[z] *loss;
TspeedY = speedX[z] *loss;
TspeedZ = speedZ[z] *loss;
speedY[z] = speedY[others];
speedX[z] = speedX[others];
speedZ[z] = speedZ[others];
speedY[others] = TspeedY *loss;
speedX[others] = TspeedX *loss;
speedZ[others] = TspeedZ *loss;
}
}
}
//BALL - FLOOR COLLISIONS
speedY[z] = speedY[z] - gravity; //gravity
speedZ[z] = speedZ[z] - 0.2;
posX[z] = posX[z] - speedX[z] *drag;
posY[z] = posY[z] - speedY[z] *drag;
posZ[z] = posZ[z] - speedZ[z] *drag;
pushMatrix();
noStroke();
translate(posX[z],posY[z],posZ[z]);
fill(50,50,200);
sphere(ballSize);
sphereDetail(10);
popMatrix();
}
}
And all of this code controls the bouncing balls. It detects if they bounce of the sides, the ground or eachother and then acts accordingly.
PImage a = loadImage("stonehouse.jpg");
beginShape();
texture(a);
translate(500+width/2.0,650+height/2.0, -100);
fill(255);
scale(300);
vertex(-20, -20, -30, 0, 0);
vertex( 20, -20, -30, 1, 0);
vertex( 20, 20, -30, 1, 1);
vertex(-20, 20, -30, 0, 1);
endShape();
}
And finally this code is just to display the image of the street behind it all. Thats all folks the sketch has been complete.
The Visual Element is Complete - Part 1
Its taken a while but we have finally completed the Processing Sketch that visualises the data we have collected. I won't post up every bit of code that features in our sketch but here are a few of the important bits:
This bit essentially parses our XML file and puts it into variables to use later on.
All of this works out when a device was first detected and when it was last detected so we can then work out how long a device has been active.
This code works out where each ball starts off in our sketch and how fast it is going. This was done manually using random numbers rather than using the data we collected otherwise they would all be doing something similar!
Thats all for now I will explain more later.
import processing.xml.*;
//DATA GATHERING
XMLElement xml;
XMLElement xmlGrandChild;
float FdetectLow = 9999999;
float LdetectHigh = 0;
int timer;
int LastTime;
int playtime = 600;
float metricTime;
String[] active = new String[1];
String[] address = new String[1];
float[] Fdetect = new float[1];
float[] Ldetect = new float[1];
String[] name = new String[1];
int[] times = new int[1];
This bit essentially parses our XML file and puts it into variables to use later on.
//First Detected
xmlGrandChild = xmlChild.getChild(5);
float temp[] = float(splitTokens(xmlGrandChild.getContent(), " :"));
Fdetect[i] = round(((temp[3]/86400)+(temp[2]/1440)+(temp[1]/24))*pow(10,6));
if(Fdetect[i] < FdetectLow){
FdetectLow = Fdetect[i];
}
//Last Detected
xmlGrandChild = xmlChild.getChild(6);
float temp2[] = float(splitTokens(xmlGrandChild.getContent(), " :"));
Ldetect[i] = round(((temp2[3]/86400)+(temp2[2]/1440)+(temp2[1]/24))*pow(10,6));
if(Ldetect[i] > LdetectHigh){
LdetectHigh = Ldetect[i];
}
}
float duration = LdetectHigh - FdetectLow; //duration in metric time
All of this works out when a device was first detected and when it was last detected so we can then work out how long a device has been active.
//initial positions and speeds
for(int x = 0; x < count;x++){
posX[x] = random((width/2)-250,(width/2)+250);
posY[x] = random(20,200);
posZ[x] = random(-10000,-9800);
speedX[x] = random(-10,10);
speedY[x] = random(-10,10);
speedZ[x] = random(10);
}
}
This code works out where each ball starts off in our sketch and how fast it is going. This was done manually using random numbers rather than using the data we collected otherwise they would all be doing something similar!
Thats all for now I will explain more later.

Saturday, 24 April 2010
The Visual Element And Processing
We have decided on our visual element once again. Now that we are using Processing we've been inspired by something that I did for IDAT102 in Processing. It was a simple 2D bouncing ball idea but the idea now is to use our data to produce bouncing balls in 3D. Jon has been working on something in his spare time using 3D bouncing balls and we will look to implement that into our project by making them bounce down an image of a street in Stonehouse. This fits in with the Transforming Stonehouse theme because our aim is to use some of the activity that occurs in other parts of the city (ie. collecting our data in the Drake Circus Shopping Centre which is in town) and then injecting that into the Stonehouse area because at the moment it is not as lively as it could be.
Tuesday, 20 April 2010
The Switch to Processing
Today, we can confirm that Jon and I are switching software from Flash to Processing. We think it will prove easier for the visual side of our project and also I am defintely more confident in using Processing that I am with Flash so it will be easier for both of us to understand and get it to work. Jon will port and translate the current actionscript over to Processing so we can start work on that. We have since decided against the bars idea however and will come up with something new soon.
Collecting The Data

Today Jon and I collected our data. We used a bluetooth adapter and stood in the middle of the mall and waited for people to walk past who had bluetooth devices turned on. When someone walked past the adapter picked up the device's name, the time it was picked up, the type of device it was and gave each one an individual ID. We managed to pick up 400 devices in just an hour and then exported it as an XML file which we can then parse.
Thursday, 15 April 2010
Issues with Flash
So we discovered that there are issues with Flash when it comes to using it for what we wanted to use it for. In Jon's Post he mentions issues with combining XML streams. If we continue to struggle we may have to change the software we using and at the moment we are considering using Processing. We will however continue to attempt to get stuff working in Flash before.
Saturday, 20 March 2010
The Visual Element
Now that we had the backbone code that will parse the XML we could start on the visual side of things. We had the idea of using blocks to represent how long a device had been active. The wider the box the longer the device had been around the area we were collecting data in. So Jon, once again the brighter half of our team, came up with a function that would do this.
What this code does is it creates a variable called myBar which takes a movie clip, in this case called mcBar, and produces a new mcBar each time. Each bar represents a particular bluetooth device. Then using translateRage (the created function you can see that essentially maps the numbers) it edits the width of the bars compared to the numbers that have been stored in the Earliest and Latest variables. Thus making the the bar wider depending on the time this particular device has been active. The height of each bar is manually set so all of the bars are the same.
So using some dummy data we managed to get something looking like this:

function barGen():void {
for (var z:Number = 1; z < device.length; z++) {
var myBar:mcBar = new mcBar();
this.addChild(myBar).name = "myBar" + z;
myBar.y= (z * 8);
var tempX = translateRange(parseInt(Earliest),parseInt(Latest),0,stage.stageWidth,parseInt(Fdetect[z]));
myBar.x = tempX;
myBar.width = (translateRange(parseInt(Earliest),parseInt(Latest),0,stage.stageWidth,parseInt(Ldetect[z])) - tempX);
myBar.height = 5;
}
//getChildByName("myBar" + z)
}
function translateRange(a1: Number, a2: Number, b1: Number, b2: Number, num:Number):Number {
var c:Number = ((num - a1) * (b2 -b1)/(a2 - a1)) + b1;
return c;
}
What this code does is it creates a variable called myBar which takes a movie clip, in this case called mcBar, and produces a new mcBar each time. Each bar represents a particular bluetooth device. Then using translateRage (the created function you can see that essentially maps the numbers) it edits the width of the bars compared to the numbers that have been stored in the Earliest and Latest variables. Thus making the the bar wider depending on the time this particular device has been active. The height of each bar is manually set so all of the bars are the same.
So using some dummy data we managed to get something looking like this:

Friday, 5 March 2010
Our Project: The Beginning
Now that we've decided we are not using Arduino we needed to decide on what we will use for our visual element. We have decided that using flash and actionscript is the way forward. Jon, being the more technical part of the team, has come up with some code that will parse the XML that will be produced by the program we are using:
Apart from parsing the XML this code also picks out data by its tags and puts it into the array you can see. An 'if' statement is used to cycle the array index. The Fdetect part you can see is uses substring to extract the date and time and to put them next to eachother so they are easier to read. The final 'if' statement checks if a date and time is more recent than the currently stored date and time for a particular device. If it is then it replaces the stored value. This allows flash to find the earliest and latest time for all of the data which will prove useful for the visual side of things.
xmlLoader.addEventListener(Event.COMPLETE, LoadXML);
xmlLoader.load(new URLRequest("data.xml"));
function LoadXML(e:Event):void {
xmlData = new XML(e.target.data);
Parse(xmlData);
}
var address = new Array(); ...
function Parse(Input:XML):void {
var Children:XMLList = Input.item.children();
for each (var Info:XML in Children) {
if (Info.name() == "address") {
address[i] = Info;
}
Fdetect[i] = temp.substring(11,13) + temp.substring(14,16) + temp.substring(17,19);
if (Fdetect[i] <>
style="font-size:78%;">Earliest = Fdetect[i];
}
Apart from parsing the XML this code also picks out data by its tags and puts it into the array you can see. An 'if' statement is used to cycle the array index. The Fdetect part you can see is uses substring to extract the date and time and to put them next to eachother so they are easier to read. The final 'if' statement checks if a date and time is more recent than the currently stored date and time for a particular device. If it is then it replaces the stored value. This allows flash to find the earliest and latest time for all of the data which will prove useful for the visual side of things.
Software Output
As stated in a previous post we have chosen our software that will collect our data. We have no deefinitely chosen our output to be XML that we will then try to parse into flash (more on this coming later). Below is a standard XML output from the software provided to me by Jon:


Thursday, 25 February 2010
Our Project and Arduino 2
So after a more thorough search around the web and other research it appears that, despite it being possible, we are no longer inplementing Arduino into our project. As mentioned it is possible but it is extremely complex and is something that is best left for a time when we are more skilled and/or have the time to do so. So this means that we are back to the original plan of collecting data using a laptop and a bluetooth adapter. This also allows us to now focus on the visual side of our product.
Sunday, 21 February 2010
The Software We Are Using
A while ago Jon posted about some software he had found. This is definitely the software we have decided to use. It records the device’s name, when it is first detected, when it was last detected and is able to output the information in a variety of formats, XML probably being the one we will use.

Image from the website
It can be found here: http://www.nirsoft.net/utils/bluetooth_viewer.html
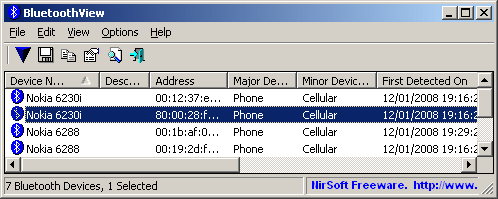
It can be found here: http://www.nirsoft.net/utils/bluetooth_viewer.html
Saturday, 20 February 2010
Our Project and Arduino
So after a brief talk with Lee and hunting the internet it appears our discovery of the bluetooth arduino board was not as good news as we first thought. It appears this device allows only communication via bluetooth rather than being able to scan and record bluetooth data on. However we are still hopeful of finding a way to use Arduino that we can use for our project otherwise we may have to abandon using Arduino all together.
Tuesday, 16 February 2010
Bluetooth Arduino Board
There is good news. After looking around it appears that there is a bluetooth arduino board which me and Jon can use for our project. The details of it at the moment are unsure as we need to look into it further. But it does look like we will be able to collect bluetooth data on it which would be ideal.


Wednesday, 10 February 2010
Arduino
Today we were introduced to Arduino by Lee Nutbeam. Arduino is made by the same people that created Processing (view my work for IDAT102 for more information). It is free software and its interface and language is very similar to Processing. Once you've used the software to write your code you can then use it with the Arduino boards. Arduino boards are devices with which people can create interactive objects or environments. Below is an example of one.

These can be used to make things such as an LED turn off and on which is what we experimented with in the session.

These can be used to make things such as an LED turn off and on which is what we experimented with in the session.
Thursday, 21 January 2010
GPS Drawing
GPS drawing is exactly what it says on the tin. It combines GPS technology, art and forms of travelling to create art on a large-scale. Below is an example of GPS Drawing.

This was something done by BMW Motorcycles. It used a GPS Sat-Nav with satellite tracking and google maps to essentially 'draw' over a landscape. The motorbike rider can then 'map out' at drawing by plotting their path on screen and then transfer their co-ordinates then all they need to do is just ride along following the GPS Sat-Nav. Then its just a case of uploading what has been dne.

This was something done by BMW Motorcycles. It used a GPS Sat-Nav with satellite tracking and google maps to essentially 'draw' over a landscape. The motorbike rider can then 'map out' at drawing by plotting their path on screen and then transfer their co-ordinates then all they need to do is just ride along following the GPS Sat-Nav. Then its just a case of uploading what has been dne.
Tuesday, 19 January 2010
Hertzian Space
We discussed hertzian space with Ben with a view to help to develop our project. So what is Hertzian Space? Hertzian space is defined as: a physical space in the electromagnetic spectrum that electronic objects influence and manipulate. Another definition would be an invisible site existing in reality that is accessed through objects and informed by imagination and experience. Below is an imagine I think helps to describe what hertzian space is.

It does link in with mine and Jon's project because bluetooth is definitely an example of Hertzian Space. This is because electronic objects such as mobile phones and bluetooth adapters can access this spectrum.

It does link in with mine and Jon's project because bluetooth is definitely an example of Hertzian Space. This is because electronic objects such as mobile phones and bluetooth adapters can access this spectrum.
Friday, 15 January 2010
Walking down to Stonehouse with Ben
On Wednesday we were introduced to a past student who graduated from our course. His name was Ben. We walked down to Stonehouse with the intention of searching for bluetooth signals. This however, for me and Jon, was quite frustrating because this was our entire idea from the beginning and now everyone would probably end up doing something similar. We also found out that using phones to find bluetooth signals was not the best idea because the mobile phone's way of searching for signals is not very strong at all. So me and Jon will continue to go ahead with getting a class one adapter and searching for signals ourselves at another time.
Subscribe to:
Posts (Atom)